STRATIQ
Quick Start — How to export your strategy from TradingView
✕ CLOSE
DEMO
1
Open
Strategy Tester
in TradingView
Go to your chart → attach your Pine Script strategy → open the Strategy Tester panel at the bottom of the screen.
2
Download
.XLSX
export
Strategy Tester → Performance Summary → click the download icon (↓) → “Save as .xlsx”.
3
Drop the file into
Stratiq
Drag & drop your .xlsx into the upload zone below — or click “Add files”. Everything runs locally. Zero bytes uploaded.
DASHBOARD
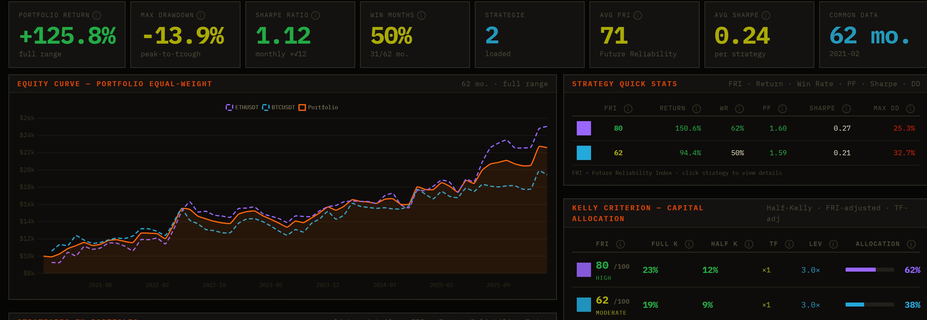
Step 2 — Your strategy,
decoded
Stratiq instantly turns your
.xlsx
into a full portfolio dashboard. Drop a second strategy to unlock cross-strategy diversification analysis.
Portfolio metrics
— Return, Max Drawdown, Sharpe Ratio, Win Months & equity curve
FRI scoring
— Future Reliability Index: OOS validation, walk-forward consistency, PF stability
Kelly position sizing
— FRI-adjusted Half-Kelly allocation with leverage caps per asset class
Monte Carlo forecasts
— 1,000 simulations, percentile bands P10–P90, stress tests on historical crises
Correlation matrix
— Find strategy pairs that hedge each other & avoid simultaneous drawdowns
← BACK
NEXT →
←
HOME
STRATIQ
Strategy Analysis Platform · v0.9 BETA
DRAG YOUR .XLSX FILES HERE
or use the button below · 1–20 strategies · EN / PL / DE / FR / ES / ZH-TW / ZH-CN
+ ADD XLSX FILES
▶ ANALYZE
I got my license key →
UPLOADED STRATEGIES
0/20
TradingView → Strategy Tester → Performance Summary → ↓ → Save as .xlsx
?
How It Works
█
CALCULATING...
parsing files...
STRATIQ
FREE
UPGRADE
RESET
Equity Curve — portfolio equal-weight
Strategies in portfolio
click → details · FRI = Future Reliability Index
Strategy contribution to portfolio
common period · Avg%/mo · Sharpe · Contribution%
PnL% monthly — portfolio
Annual results — market regimes
total %/year · % profitable months
Strategy Quick Stats
FRI · Return · Win Rate · PF · Sharpe · DD
Kelly Criterion — capital allocation
Half-Kelly · FRI-adjusted · TF-adj
Simultaneous Drawdown
months when ALL strategies lose
Portfolio analysis — market context
← ← BACK TO PORTFOLIO
🔒 Correlation analysis requires
Pro plan
— compare up to 10 strategies
Upgrade to Pro — $9/mo →
Activity heatmap — when each strategy earns
green=profit · red=loss · hover=value
PnL% monthly — all strategies
look for months when strategies profit at different times
Best pair synergies ≥90%
% months when ≥1 earns
Pairs losing simultaneously — risk
% months when BOTH lose
Full correlation matrix
PnL% monthly · <0.4 good · 0.4-0.7 moderate · >0.7 high · negative=hedge
🔒 Monte Carlo & Forecasts require
Pro plan
Upgrade to Pro — $9/mo →
Capital — used in all calculations
Kelly-weighted · FRI-adjusted
Returns calculator — portfolio history
how much the portfolio earned in a given period
Monte Carlo — portfolio projection (1000 simulations)
random permutations of historical months · not a forecast
HORIZON:
6 mo.
12 mo.
24 mo.
Stress tests — historical crises
how the portfolio handled market crashes
Position sizing — risk management per strategy
how much to invest per Kelly · max loss per trade
#
Type
Strategy
Entry
Entry price
Exit
Exit price
PnL
PnL %
Kum.
Run-up
DD